
Implied Volatility · Glossary
VIX Explained: What the CBOE Volatility Index Says and How It Is Calculated
Founder of OptionsApp, active in the markets for 20+ years.
The VIX (CBOE Volatility Index) is a volatility index calculated by CBOE (Chicago Board Options Exchange) since 1993 that expresses the market-implied 30-day expected variation of the S&P 500 (US stock index of the 500 largest publicly listed US companies, ticker SPX) in annualized percent. The index is derived from the mid prices of liquid SPX puts and calls and is therefore a direct market price of implied volatility, the market-expected future variation derived from option prices. It is closely related to the Greek Vega and a central reference point among the option Greeks, though VIX itself is not a Greek but a systemic volatility measure.
Current VIX (delayed)
Reading: below 15 calm, 15 to 20 normal, 20 to 30 elevated, 30 to 40 stress, above 40 crisis. As of 10/02/2026, 04:15 PM, delayed at least 15 minutes. Source: CBOE. Informational value only, not a signal and not investment advice.
Key takeaways at a glance
- VIX measures the market-expected 30-day volatility of the S&P 500, derived from mid-prices of liquid SPX options, not from historical prices.
- Rule of 16: expected daily movement in percent equals VIX divided by 16. VIX 20 corresponds to roughly 1.25 percent daily movement (exactly 1.26 percent via sqrt(252)).
- VIX and S&P 500 are inversely correlated, typically between -0.7 and -0.85; on strong SPX down days, VIX rises on average 8 to 12 percent.
- Long-vol ETPs like VXX and UVXY carry roll-yield decay of roughly -8 to -12 percent monthly under sustained contango; the inverse SVXY instead benefits from contango but carries severe crash risk. Neither group is a buy-and-hold instrument.
- The final settlement value for VIX derivatives (VRO) is derived from an SPX auction on settlement morning and can deviate from the pre-open VIX.
- VVIX above 130 signals stress in the vol market itself and has historically pointed to VIX spikes days in advance.
VIX at a glance
- Calculated by CBOE since 1993, since 2003 via variance swap replication from SPX options.
- Reported in annualized percent, scaled to one year. A VIX of 20 implies roughly 1.26 percent expected daily movement.
- Closing ATH 82.69 on 16 March 2020. Intraday ATH 89.53 on 24 October 2008.
- Term structure sits in contango about 84 percent of the time.
- VIX spot is not directly tradable. Only derivatives (VIX futures, VIX options, VXX, UVXY, SVXY).
Basis
SPX
S&P 500 index options
Horizon
30 days
annualized, in percent
Normal regime
15-20
VIX points
What is the VIX?
The VIX is an index that captures the expected variation of the S&P 500 over the next 30 days in annualized percent. Its basis is not historical prices but the mid prices of liquid SPX options that contain the market's expectation of future moves. The VIX is therefore a market measure of the implied, risk-neutral volatility; because of the volatility risk premium it tends to run above later realized movement and is not an exact forecast.
Colloquially the VIX is often called the fear gauge. That label is shorthand. The VIX measures volatility expectation, not directional sentiment. A rising VIX only shows that options have become more expensive, implicitly pricing larger moves. Whether those moves are up or down is not something VIX expresses.
Operationally the VIX streams in real time between 03:15 and 16:15 New York time and is continuously recomputed from the two nearest SPX expirations. Final settlement values for VIX derivatives are determined separately by the SOQ (Special Opening Quotation) process on settlement morning.
History: From S&P 100 VIX (1993) to the modern SPX VIX (2003)
The VIX was created in 1993 by Robert E. Whaley for CBOE, originally based on S&P 100 index options (OEX) and an ATM-centric Black-Scholes implied volatility. That first generation was conceptually clean but not free of model assumptions because it depended on a specific pricing formula.
In 2003 the VIX was overhauled. CBOE switched to S&P 500 options (SPX) and to a model-free variance swap replication. The new methodology reads expected variance directly from a strip of OTM puts and calls without relying on a pricing formula. This variant has been the official VIX since then. The legacy OEX variant continues under the ticker VXO.
Building on the new methodology, VIX futures launched in 2004 on the CBOE Futures Exchange. VIX options followed in 2006 on CBOE itself. This established a dedicated volatility-derivatives ecosystem that turns over billions in daily volume today.
How the VIX is calculated: variance swap methodology
Since 2003 the VIX has been computed as the square root of a 30-day interpolated expected variance, derived from a strip (weighted sum of many options across all liquid strikes) of OTM SPX puts and calls. The methodology replicates a variance swap (volatility exchange derivative whose replication via a strip of options forms the basis of the VIX methodology) and is therefore model-free.
- T
- time to expiration in years
- K_i
- i-th strike in the strip
- Q(K_i)
- mid price of the OTM option at strike K_i
- F
- forward index level
- r
- risk-free rate
σ² = (2 / T) · Σ (ΔK_i / K_i²) · e^(rT) · Q(K_i) − (1 / T) · (F / K_0 − 1)²VIX = 100 · √(σ²_30d)σ²_30d is interpolated from the two nearest SPX expirations
Strip of SPX puts and calls
The strip covers all OTM puts below the forward (theoretical SPX price at expiration, derived via put-call parity at the strike where call and put mid prices line up most closely) and all OTM calls above it, each up to the first run of two consecutive zero-bid options. Zero-bid options are excluded because their prices carry no genuine market expectation. Each included strike enters the sum weighted by ΔK_i / K_i², so deep-OTM options receive less weight than near-ATM options.
Interpolation to 30 days
The two expiry strips yield two variances that are linearly combined to produce exactly a 30-day residual maturity. The result is then annualized by 365 / 30, square-rooted and multiplied by 100. The output is the VIX value in points, which expresses the option-strip-implied, risk-neutral 30-day vol of the S&P 500 in percent per year.
How to read the VIX: typical regimes
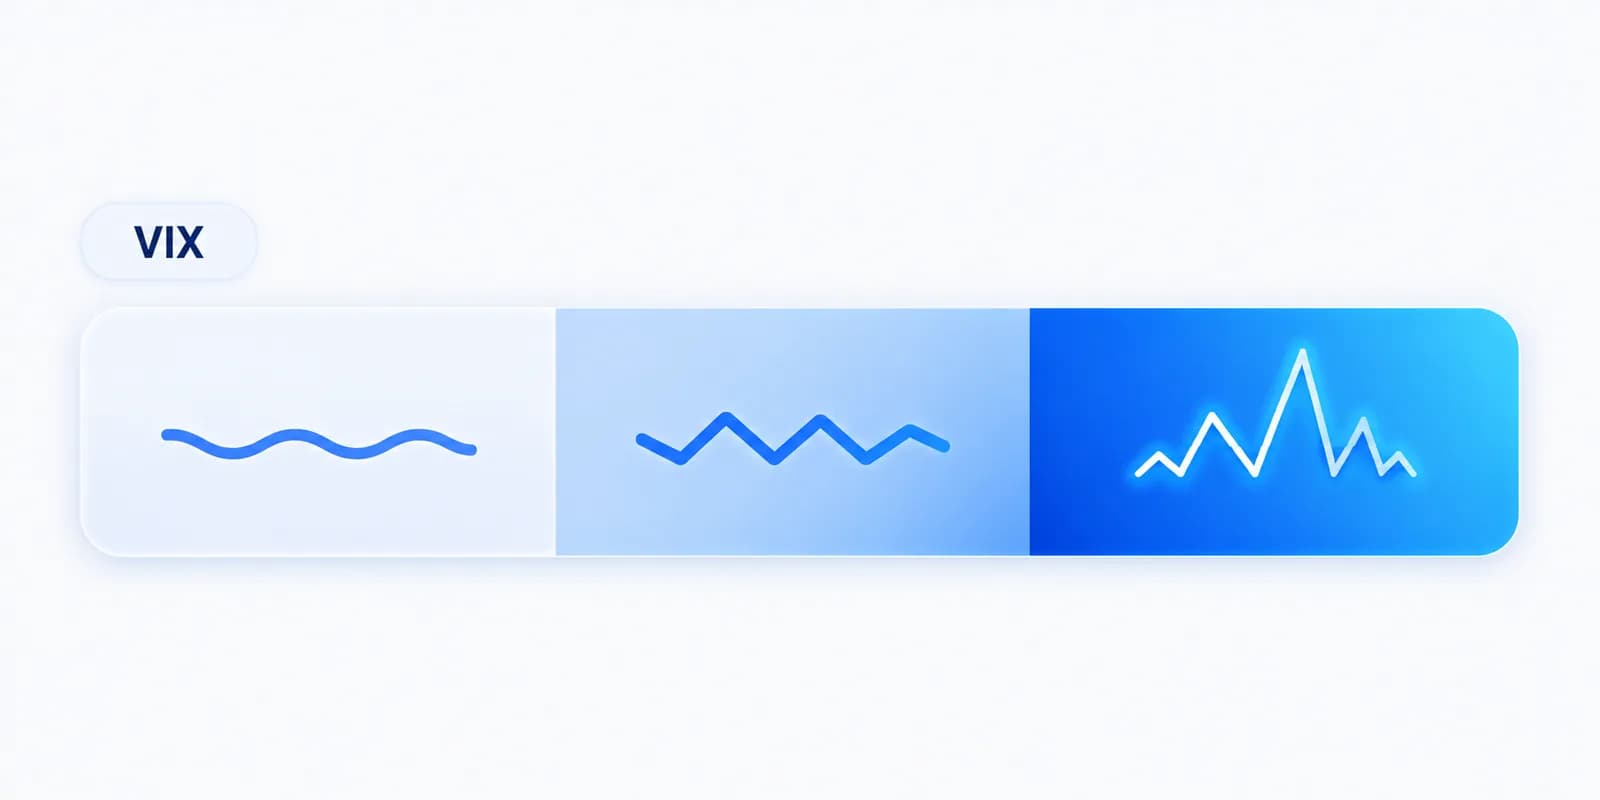
The VIX is reported in points that reflect the option-implied annualized vol. A VIX of 20 means roughly 20 percent implied annual vol. From this logic the common range conventions follow, which act as reference points in practice.
Rule of 16: from VIX to daily volatility
The rule of 16 is the quickest way to translate a VIX level into expected daily movement. Background: a year has about 252 trading days, sqrt(252) is 15.87, rounded to 16. The conversion is: expected daily movement in percent equals VIX divided by 16.
- VIX 12
- 12 / 16 = 0.75 % expected daily move
- VIX 16
- 16 / 16 = 1.00 % expected daily move
- VIX 20
- 20 / 16 = 1.25 % expected daily move
- VIX 32
- 32 / 16 = 2.00 % expected daily move
- VIX 48
- 48 / 16 = 3.00 % expected daily move
These values are the market's one-standard-deviation expectation for a daily S&P 500 move. Roughly 68 percent of days should stay within that band, around 5 percent should fall outside the two-sigma band (twice the value). The rule is a quick translation, not a model, and assumes lognormal returns, which does not strictly hold in reality due to tail events.
- VIX < 15
- calm market, low expected vol
- VIX 15-20
- normal regime
- VIX 20-30
- elevated uncertainty
- VIX 30-40
- stress regime
- VIX > 40
- crisis phase
These bands are orientation, not a rulebook. A VIX of 22 is not automatically a sell signal for premium, and a VIX of 14 is not a ban on opening premium-selling setups. In practice the term structure and the relative position against your own history (keyword IV-Rank) play a larger role than the absolute level.
VIX term structure: contango and backwardation
The term structure (the curve of VIX futures prices across expirations) is the sequence of VIX futures prices from front to back month. It shows whether the market is pricing higher vol for short or for longer horizons and is therefore a central tool that goes beyond the spot level.
Contango (rising forward curve, front-month futures below back-month) is the normal state. Academic studies since 2004 indicate the VIX term structure trades in contango on roughly 84 percent of trading days. In contango, rolling front to back futures produces a negative roll yield (return effect from rolling futures, negative for long-vol ETPs in contango), which structurally drags long-vol ETPs like VXX.
Example: how VIX futures trade under contango
Under contango the future is more expensive than the present. Suppose VIX spot prints 15 today, but the next-month VIX future costs 18. Buying that future costs a 3-point fear premium for the uncertainty of the coming weeks. A VIX future pays out when VIX at settlement closes above the purchase level. One point equals 1,000 USD.
The catch: convergence to the spot price. At expiration the future must equal the actual VIX index. If markets stay calm and VIX prints 15 throughout, the future bleeds slowly from 18 down to 15.
The outcome: Because no panic erupted and VIX stayed put, the position loses 3,000 USD per contract (3 points x 1,000 USD). The premium was paid for a disaster that never came. The technical term is negative roll yield.
Think of it like a monthly insurance premium: if the house does not burn, the premium is gone at the end of the month. Because the S&P 500 stays calm or rises on roughly 84 percent of trading days, traders who hold VIX futures (or ETPs like VXX) long-term burn capital while waiting for the one big crash.
Backwardation (falling forward curve, front-month above back-month) typically appears in stress regimes. In backwardation the roll yield flips positive for long-vol vehicles, and the curve signals that the market expects higher vol short-term than long-term. August 2024 is a textbook example: the front futures curve shot up briefly, while the back end remained well below.
Historical VIX spikes since 1993
The VIX has seen several distinctive spikes throughout its history. The table below lists the most important reference points and their triggers. A notable observation: the closing ATH sits below the intraday ATH because markets typically bleed off pressure between midday and the bell once liquidity returns.
| Date | VIX value | Trigger |
|---|---|---|
| 24.10.2008 | 89,53 (Intraday) | Financial crisis, post-Lehman |
| 20.11.2008 | 80,86 (close) | Financial crisis, equity lows |
| 05.02.2018 | ~50 (Intraday) | Volmageddon, liquidation of the XIV ETP |
| 16.03.2020 | 82,69 (closing ATH) | COVID-19 shock |
| 05.08.2024 | ~65,73 (Intraday) | Yen carry unwind, +180 percent vs prior close |
5 August 2024 deserves its own mention: according to BIS Bulletin No 95 the single-day jump of roughly +180 percent over the prior close was the largest in VIX history. The trigger was a yen carry unwind combined with thin US liquidity, which catapulted front VIX futures sharply higher before the situation stabilized the same day. The SEC DERA working paper analysis classifies the spike as primarily a microstructure event rather than a fundamental vol regime shift.
Can the VIX be traded directly? VIX futures, VIX options, VXX and UVXY
The VIX spot value itself is not tradable because as a computational output it is not a deliverable product. Only derivatives on the VIX are tradable. The three main groups: VIX futures, VIX options and volatility ETPs (Exchange-Traded Product, exchange-listed vehicle, umbrella term for ETF and ETN) such as VXX, UVXY and SVXY.
VIX futures
VIX futures have been listed on the CBOE Futures Exchange since 2004. They are cash-settled, the final settlement price is determined on settlement morning by the SOQ (Special Opening Quotation, settlement-morning auction that determines the final settlement price of VIX derivatives) over SPX options. Available are monthly expirations (standard, Wednesday settlement) and weekly expirations. The multiplier is 1,000 USD per point, mini VIX futures (VXM) are 100 USD per point.
VIX options
VIX options have traded on CBOE since 2006. Important and often misunderstood: VIX options are written on the corresponding VIX futures, not on the current VIX value. A VIX call with strike 20 asks whether the matching VIX future closes above 20, not the spot level. Final settlement also runs through the SOQ process.
Practical consequence: in backwardation the VIX spot can sit at 30 while the three-month future trades at 22. A VIX option referencing that back-month future prices off 22, not 30. This routinely confuses beginners because option prices and spot can decouple.
VXX, UVXY, SVXY
VXX (iPath Series B S&P 500 VIX Short-Term Futures ETN) tracks a constant 30-day maturity by rolling a portion of its assets each day from the front to the second VIX future. UVXY is the 1.5x leveraged version, SVXY the inversely leveraged version (-0.5x since 2018). Under sustained contango the daily rolling produces structural decay of roughly -8 to -12 percent per month. VXX has undergone multiple reverse splits since launch, mostly to keep the price out of the single-digit range.
Structural decay
VXX, UVXY and similar long-vol ETPs are trading vehicles, not buy-and-hold investments. Holding them longer term means carrying contango roll-yield decay and the path-dependent tracking risk of leveraged products. On 5 February 2018 (Volmageddon) the inverse XIV ETN was liquidated after an 80 percent single-day loss under its termination clauses.
VIX vs related indices: VSTOXX, VXN, RVX, VVIX
The VIX has numerous sibling indices that apply the same methodology to other underlyings. The most relevant for European traders is the VSTOXX (EUREX Euro Stoxx 50 Volatility Index).
| Index | Underlying | Exchange | Note |
|---|---|---|---|
| VIX | S&P 500 (SPX) | CBOE | global benchmark |
| VSTOXX | Euro Stoxx 50 | EUREX | ISIN DE000A0C3QF1, European counterpart |
| VXN | NASDAQ-100 (NDX) | CBOE | tech-heavy, typically above VIX |
| RVX | Russell 2000 (RUT) | CBOE | small-cap vol |
| VVIX | VIX-Optionen | CBOE | vol of vol, typically 80-120 |
The table is orientation. Which index is relevant for an individual trader depends on the underlying universe traded and is a personal decision. VVIX is a special case because it measures the implied volatility of the VIX options themselves and therefore tells you how uncertain the market is about future VIX moves. Values above 130 indicate stress in the vol market itself.
Inverse correlation: VIX and S&P 500
VIX and S&P 500 move predominantly in opposite directions. The correlation coefficient between daily VIX changes and SPX returns typically sits between -0.7 and -0.85, measured over rolling 30- to 90-day windows. On days with a clearly falling SPX (below -1 percent), VIX rises on average 8 to 12 percent, on strong up days it retraces. This asymmetry is called the leverage effect: investors price higher protection premia for puts when markets fall, which lifts implied volatility and the VIX with it.
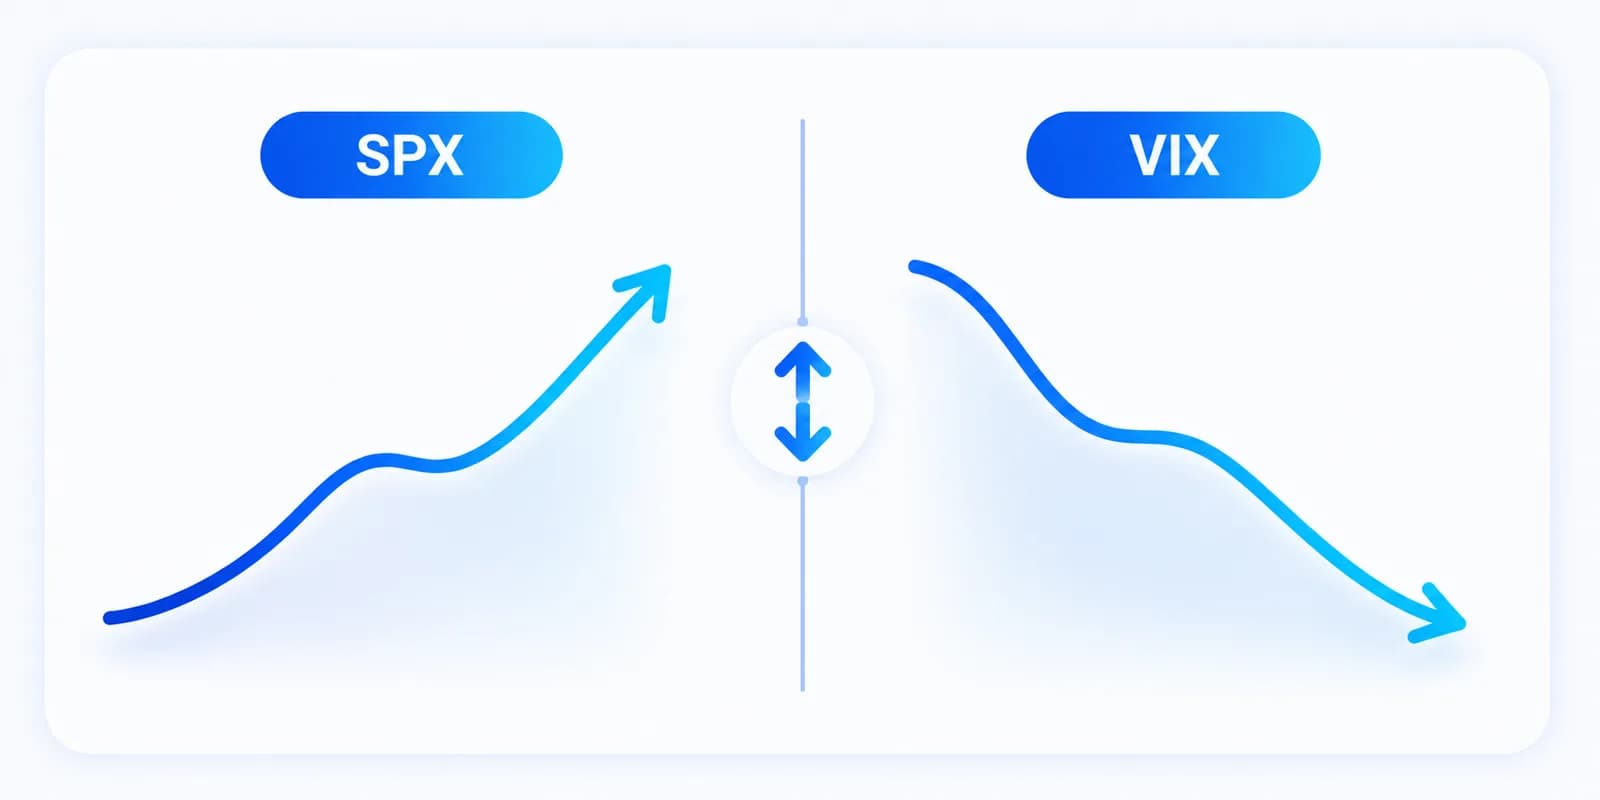
Important for premium sellers: the correlation is not -1. There are periods where SPX and VIX rise together, for example when the market stays nervous in a rally and option prices stay elevated despite rising prices. Such divergence phases are practical early warnings because the market prices a correction more expensively than the upmove suggests.
VVIX as an early-warning indicator for vol stress
VVIX (volatility of VIX) measures the implied volatility of VIX options themselves. In other words: VVIX expresses how uncertain the market is about VIX moves over the next 30 days. While VIX captures vol expectation for the S&P 500, VVIX captures vol expectation for the VIX itself, i.e. vol-of-vol. Values are reported in points.
- VVIX 80-100
- calm vol market, normal VIX swings expected
- VVIX 100-120
- standard range, mild tension
- VVIX 120-140
- elevated uncertainty about VIX moves
- VVIX > 140
- stress in the vol market, often a precursor to SPX vol spikes
In practice VVIX has signalled stress in several historical periods before VIX itself spiked. In early August 2024, ahead of the 5 August spike, VVIX had already moved to roughly 130 while VIX still printed below 20. Traders who use VVIX as an additional filter alongside VIX and term-structure tend to have a multi-day head start versus pure VIX-driven setups.
VRO: how the monthly VIX settlement is determined
The final settlement value for VIX futures and VIX options is calculated under the dedicated ticker "VRO" (Special Opening Quotation, also called "VRO" in CBOE notation) on settlement Wednesday. VRO is therefore the only value that matters at final settlement; the streaming VIX value over the last trading days does not affect payout.
VRO is derived from a special auction (Opening Auction) of SPX options that expire exactly 30 days after settlement Wednesday. Only auction opening prices count, not subsequent trades. Because of this mechanic, VRO at the settlement morning can differ noticeably from the pre-open VIX, especially when SPX option liquidity in the auction is thin.
Practical consequences: VIX futures that trade only thinly in the final hour before settlement are anchored to the auction outcome. Traders who carry open VIX future positions into settlement Wednesday accept gap risk through the VRO auction price. Many active vol traders therefore close VIX future positions the day before or roll into the next expiration in time.
VIX vs the implied volatility of a single option
The VIX is a systemic SPX-level metric and not to be confused with the implied volatility of an individual option. The overarching concept of implied volatility is defined on every option, every strike and every expiration. The VIX condenses an aggregate from that for the 30-day horizon of the S&P 500.
Operationally relevant: the Vega sensitivity of an option reacts to changes in its own IV, not directly to VIX. A rising VIX translates only indirectly into rising single-option vega, depending on skew and smile.
Also important: the IV Rank is not the VIX. IV Rank measures where the current IV of a specific underlying sits within its own 52-week range, so it is the IV Rank per underlying, an entirely different metric from the systemic VIX. Both complement each other in practice: VIX gives the systemic picture, IV Rank gives the underlying-specific situation.
How premium sellers read the VIX
Premium sellers, traders who sell option premium, read the VIX primarily as a filter and as a risk gauge. A high VIX means more expensive SPX options and therefore more premium per unit sold. A low VIX means thinner premium and a larger risk that small moves will eat up the credit collected.
In practice many active premium sellers combine the VIX with the IV Rank per underlying. The VIX delivers the systemic picture, IV Rank decides whether the individual underlying is expensive or cheap in its own history. In OptionsApp, SPX and SPY premium-selling setups can be filtered by VIX thresholds and strategies opened automatically when a stored rule set fires.
An important point: a VIX threshold is not a law of nature. What looks premium-thin at VIX 16 can still make sense for a consistently automated setup with small sizing. What looks attractive at VIX 30 can flip exactly during a stress spike. How an individual trader handles this depends on the personal rulebook and is a personal decision.
Example: VIX-based SPX premium-seller filtering
One possible example setup of how an automated SPX premium-seller workflow can use the VIX as a filter. The thresholds are illustrative, not a recommendation; which values belong in your own rulebook is the trader's call:
- VIX > 20: entry trigger for SPX Iron Condor with 16-delta short strikes, around 45 DTE (Days to Expiration), provided no open positions on the same expiration.
- VIX 15-20: reduced sizing, optionally narrower spread width or switching to a bull put spread instead of a full Iron Condor.
- VIX < 15: no new entry, because premium is too thin for the stored rule set.
- Backwardation switch: if the VIX term structure flips into backwardation, the entry workflow pauses, because elevated follow-on vol is typically expected.
This is an example, not a rulebook. Concrete thresholds, sizing and strategy selection depend on the individual account, experience and risk profile and must be set individually.
Practical observations
Experience suggests the VIX serves active SPX premium sellers less as a sole primary criterion and more as a context gauge. The following observations are observation-based and do not replace an individual rulebook. Each trader decides how to use it.
Three recurring observations:
- The absolute VIX level alone tends to be a less reliable entry signal than the combination of VIX level and term-structure shape.
- Backwardation phases are often a signal to reduce sizing or pause new entries, because the following weeks typically run turbulent.
- A VVIX (vol-of-vol index) above 120 can act as a more informative early-warning gauge than a VIX above 25, because VVIX captures uncertainty about the VIX itself.
VIX FAQ
What is the VIX in simple terms?
The VIX is an index calculated by CBOE (Chicago Board Options Exchange) that expresses the market-implied 30-day variation of the S&P 500 in annualized percent. It is derived from mid prices of liquid SPX puts and calls and is the most widely tracked volatility index in the world.
How is the VIX calculated?
Since 2003 the VIX has been calculated via variance swap replication. The expected variance is summed from a strip of OTM puts and calls in the two nearest SPX expirations, interpolated to 30 days, annualized and converted to a vol-point value via 100 times the square root. The exact mechanics are documented in the CBOE VIX white paper.
What does a VIX of 20 mean?
A VIX of 20 means the market expects an annualized 30-day variation of the S&P 500 of about 20 percent. Converted to a single day this is roughly 1.25 percent by the rule of 16 (exactly 1.26 percent via 20 divided by sqrt(252)). The range 15 to 20 is historically the normal regime without elevated stress.
What is the difference between VIX and VSTOXX?
The VIX tracks the S&P 500, the VSTOXX (EUREX Euro Stoxx 50 Volatility Index, ISIN DE000A0C3QF1) tracks the Euro Stoxx 50. Methodologically both are very close, both use variance swap replication from liquid index options. VSTOXX trades on EUREX and is the European counterpart to the VIX, typically with high co-movement.
Can you buy the VIX directly?
No, the VIX spot value itself cannot be purchased. Only derivatives are tradable: VIX futures (cash-settled, final settlement via the SOQ auction), VIX options (which trade on VIX futures, not on the current VIX value) and ETPs like VXX, UVXY or SVXY that roll VIX futures.
Why does VXX decay structurally?
VXX rolls front-month VIX futures into later months. In contango it sells cheaper front contracts and buys more expensive back contracts. This negative roll yield produces a structural decay of roughly -8 to -12 percent per month under sustained contango. VXX has had multiple reverse splits since launch and is unsuitable as a buy-and-hold vehicle.
When was the VIX at its highest?
The highest closing value was 82.69 on 16 March 2020 at the start of the COVID crisis. The highest intraday print was 89.53 on 24 October 2008 during the financial crisis. The largest single-day spike in VIX history occurred on 5 August 2024 with a gain of roughly 180 percent over the prior close and an intraday high near 65.73, documented in BIS Bulletin No 95.
What is the difference between VIX and IV Rank?
The VIX is a systemic vol metric on SPX level and not directly comparable to the implied volatility (IV) of a single stock. IV Rank measures where the current IV of a specific underlying sits within its own 52-week range. The two metrics complement each other: VIX gives the systemic picture, IV Rank the underlying-specific situation.
Open SPX premium-selling setups VIX-filtered and automated
OptionsApp can filter SPX and SPY premium-selling setups by stored VIX thresholds and open them automatically. Profit target, position review and stop logic run mechanically by the values you set. Strategy choice, sizing and market view remain the trader's call.
More in the automated premium-selling guide.