
Implied Volatility · Glossary
VSTOXX Explained: The European Volatility Index
Founder of OptionsApp, active in the markets for 20+ years.
VSTOXX in 30 seconds
The VSTOXX (EURO STOXX 50 Volatility Index, ticker V2TX, ISIN DE000A0C3QF1) is a volatility index calculated by STOXX Limited (Zurich-based index provider, subsidiary of the Deutsche Börse Group) and EUREX (European derivatives exchange in Frankfurt and Zurich) that expresses the market-implied 30-day variation of the Euro Stoxx 50 (Eurozone blue-chip index of the 50 largest names) in annualized percent.
Its basis is a variance swap replication from bid-ask quotes of liquid Euro Stoxx 50 options on EUREX. Premium sellers read elevated VSTOXX values as a signal of richer option premia, long-term equity investors read the index as a rough stress gauge for the Eurozone.
Risk note: The VSTOXX itself is not tradable. Only the FVS futures and OVS2 options are tradable, both are high-risk derivatives.
Key takeaways at a glance
- ISIN DE000A0C3QF1, ticker V2TX, provided by STOXX Limited and EUREX, launched in 2005 with a model-free methodology, data history backfilled to 1999.
- Long-term average 18 to 22 points, historical range 11 to 87, crisis peaks above 85 (Lehman October 2008, Covid March 2020).
- Correlation to Euro Stoxx 50 around -0.78, inverse but not mirror-like; on heavy down days VSTOXX rises by double-digit percentages on average.
- FVS futures multiplier 100 EUR per volatility point, roughly one tenth of the VIX futures standard size (1,000 USD).
- 8 sub-indices with fixed maturities (1, 2, 3, 6, 9, 12, 18, 24 months) plus 12 rolling main indices (30 to 360 days in 30-day steps).
- FVS settlement via time-weighted average price (TWAP) between 11:00 and 12:00 CE(S)T (since January 2024), not via an auction as for VIX (VRO).
VSTOXX at a glance
- STOXX Limited and EUREX launched the index in 2005 with a model-free methodology, with data history backfilled to 1999.
- Updates every 5 seconds during trading hours of Euro Stoxx 50 options.
- FVS and OVS2 derivatives are listed on EUREX, both cash-settled.
- More than 21 million contracts traded in VSTOXX derivatives on EUREX in 2024.
- The VSTOXX value itself is not directly tradable. Only derivatives (FVS, OVS2).
Underlying
SX5E
Euro Stoxx 50 options
Horizon
30 days
annualized, in percent
Normal regime
18-22
VSTOXX points
What the VSTOXX measures
The VSTOXX measures the market-implied 30-day variation of the Euro Stoxx 50 in annualized (scaled to one year) form. Its basis is not historical prices but the mid prices of liquid Euro Stoxx 50 options that contain the market's expectation of upcoming moves. The VSTOXX is therefore a market measure of implied volatility (IV), the market-expected future variation derived from option prices.
Some financial media call the VSTOXX a European fear gauge. The label is shorthand: the VSTOXX measures volatility expectation, not directional sentiment. A rising VSTOXX only shows that options have become more expensive, implicitly pricing larger moves. Whether those moves are up or down is not something the index expresses.
The index family covers 8 sub-indices with fixed maturities (1, 2, 3, 6, 9, 12, 18 and 24 months) and 12 main indices with rolling residual maturities from 30 to 360 days in 30-day steps. The headline VSTOXX value corresponds to the rolling 30-day index, comparable to the VIX in the US.
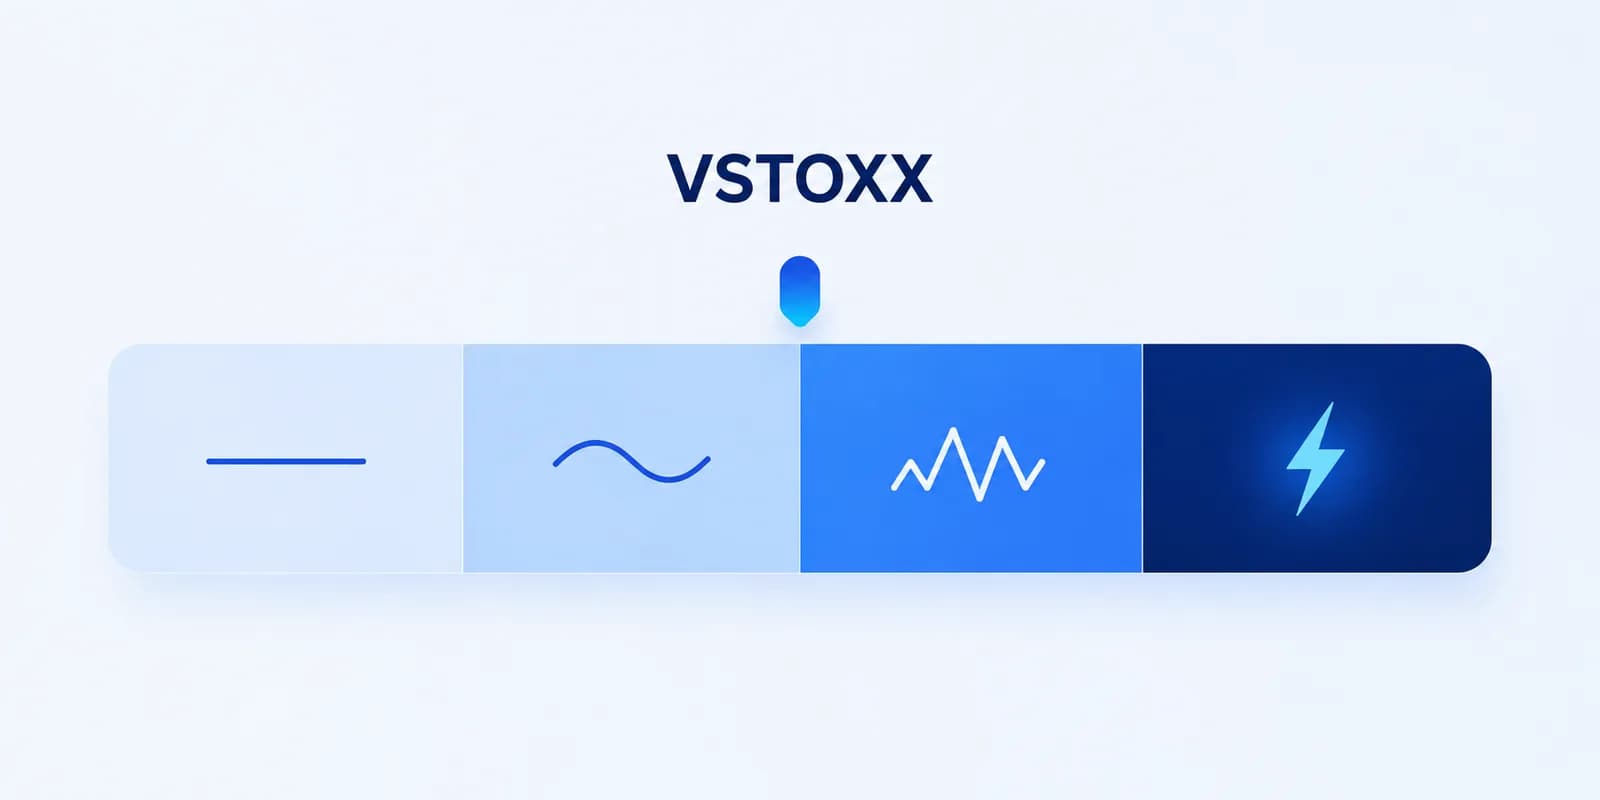
- VSTOXX < 15
- calm market, thin option premia
- VSTOXX 18-22
- long-term normal regime
- VSTOXX 25-35
- elevated uncertainty, often after news shocks
- VSTOXX 35-50
- stress regime, historically often near index lows
- VSTOXX > 50
- crisis mode, examples August 2011, March 2022
Calculation methodology: variance swap replication
Since 2005 the VSTOXX has been calculated via a model-free variance swap replication (no Black-Scholes assumptions, only observed option prices). From a strip of OTM puts and calls in the nearest Euro Stoxx 50 expirations, expected variance is summed, interpolated to 30 days, annualized and converted to a vol-point value via the square root. Methodologically this is exactly the same logic the VIX has used since 2003.
Theoretically the methodology rests on replicating a variance swap (OTC derivative on the realized variance of an underlying, the theoretical basis of modern volatility indices) through a portfolio of options across all strikes. The original derivation comes from the Goldman Sachs paper by Demeterfi, Derman, Kamal and Zou (1999), the academic bridge to VIX and VSTOXX is laid by Carr and Wu (2006). Anyone who has internalized the VIX formula has VSTOXX along with it, just with Euro Stoxx 50 options instead of SPX options.
- T
- time to expiration in years
- K_i
- i-th strike in the strip
- Q(K_i)
- mid price of the OTM option at strike K_i (Euro Stoxx 50)
- F
- forward index level (theoretical future price of the Euro Stoxx 50 at option expiration, derived from put-call parity)
σ² = (2 / T) · Σ (ΔK_i / K_i²) · e^(rT) · Q(K_i) − (1 / T) · (F / K_0 − 1)²VSTOXX = 100 · √(σ²_30d)σ²_30d interpolated from the two nearest Euro Stoxx 50 expirations
V-VSTOXX (VVS) as a vol-of-vol index
Analogously to VVIX in the US, STOXX calculates a V-VSTOXX (ticker VVS) that measures the volatility of VSTOXX itself, i.e. vol-of-vol (volatility of the volatility, how much the volatility index itself moves). The V-VSTOXX has flagged stress in European vol markets in several historical phases before the VSTOXX itself turned higher. Values above 130 indicate elevated uncertainty about future VSTOXX moves.
VSTOXX vs VIX: side-by-side comparison
Methodologically VSTOXX and VIX are close cousins. Practically they differ in underlying, exchange, contract size and settlement mechanic. Anyone using both indices in parallel should know the differences to avoid mistranslating between US and EU setups.
| Feature | VIX | VSTOXX |
|---|---|---|
| Underlying | S&P 500 | Euro Stoxx 50 |
| Options exchange | CBOE | EUREX |
| Index sponsor | CBOE | STOXX Limited |
| Methodology | variance swap replication (model-free) | variance swap replication (model-free) |
| Index ticker | VIX | V2TX |
| ISIN | n/a (US index) | DE000A0C3QF1 |
| Historical range | 9 bis 89 | 11 bis 87 |
| Correlation to its index | around -0.75 | around -0.78 |
| Futures symbol | VX (CFE/CBOE Futures) | FVS (EUREX) |
| Futures multiplier | 1,000 USD per vol point | 100 EUR per vol point |
| Settlement mechanic | VRO auction (Special Opening Quotation) | TWAP 11:00-12:00 CE(S)T |
| Data since | 1990 (introduced 1993, modern methodology 2003) | 1999 (backfilled, launched 2005) |
| Vol-of-vol index | VVIX | V-VSTOXX (VVS) |
A practical takeaway: a VSTOXX futures contract (100 EUR per point) is roughly one tenth of the notional size of a VIX futures contract (1,000 USD per point), which makes VSTOXX derivatives more capital-efficient for smaller European accounts. The TWAP settlement mechanic of FVS futures (weighted average of the VSTOXX index between 11:00 and 12:00 CE(S)T, since January 2024) also reduces the auction sensitivity that VIX via VRO occasionally exhibits.
What does this mean for a portfolio?
For a predominantly European portfolio the VSTOXX captures the relevant risk: it measures the expected swing of the Euro Stoxx 50 and can be hedged capital-efficiently via FVS futures. The VIX remains the reference for S&P 500 risk and the more liquid vol derivatives, while DAX investors find in the VSTOXX a workable continental-Europe barometer whose exact counterpart is the VDAX-NEW.
V2X futures and options: FVS and OVS2
The VSTOXX value itself is not tradable because it is a computational output, not a deliverable product. Only two derivatives are tradable, both on EUREX, often referred to as the V2X derivative family (VSTOXX futures and the related options): VSTOXX futures under the symbol FVS (EUREX symbol of the VSTOXX future) and options on VSTOXX futures under the symbol OVS2 (EUREX symbol for options on VSTOXX futures). Both are cash-settled.
FVS: the VSTOXX future
FVS futures have been listed on EUREX since 2009. The multiplier is 100 EUR per volatility point, roughly one tenth of the VIX futures standard size. Monthly expirations are available. The final settlement price is not an auction (as for VIX via VRO) but the time-weighted average price (TWAP, weighted average between 11:00 and 12:00 CE(S)T, since January 2024) of the underlying 30-day VSTOXX sub-index. The TWAP mechanic makes settlement less prone to the micro-auction effects that VRO occasionally suffers from.
OVS2: options on VSTOXX futures
OVS2 options, like VIX options in the US, are written on the respective VSTOXX futures, not on the spot VSTOXX value. An OVS2 call with strike 20 asks whether the matching FVS future closes above 20 at expiration, not the current VSTOXX value. In backwardation the VSTOXX index value can sit at 28 while the third front FVS future trades at 22, and the OVS2 option will price off 22, not 28. This mechanic routinely confuses beginners.
Risk notice for volatility derivatives
FVS futures and OVS2 options are high-risk derivatives. In Germany they are taxed under § 20 (2) EStG. The earlier 20,000 EUR per year loss-offset cap for derivatives was abolished retroactively from 2020 onwards by the 2024 Annual Tax Act (status May 2026). This page is not investment advice and not tax advice.
Historical VSTOXX spikes
The VSTOXX has produced several distinctive peaks since 1999. The table below lists the key reference points and their triggers, the accompanying diagram shows the schematic path with the spike markers.
| Date | Trigger | VSTOXX peak |
|---|---|---|
| October 2008 | Global financial crisis (Lehman collapse) | above 85 |
| August 2011 | Euro crisis, US downgrade | around 53 |
| August 2015 | China crash | around 41 |
| February 2018 | Volmageddon | around 35 |
| March 2020 | Covid crash | around 86 |
| March 2022 | Ukraine invasion, energy shock | around 49 |
A notable pattern: the two absolute highs (October 2008 and March 2020) sit very close together despite fundamentally different triggers. That points to a practical ceiling regime for VSTOXX in extreme stress phases, in which the option price structure itself becomes distorted by liquidity constraints.
VSTOXX as a contrarian gauge for the Euro Stoxx 50
VSTOXX and Euro Stoxx 50 mostly move in opposite directions. The correlation coefficient between daily VSTOXX changes and Euro Stoxx 50 returns typically sits between -0.70 and -0.85, measured over rolling 30- to 90-day windows. On days with a clearly falling Euro Stoxx 50 the VSTOXX rises by double-digit percentages on average. This asymmetry is the familiar leverage effect: investors price higher protection premia for puts in falling markets, which lifts implied volatility and the VSTOXX with it.
From this asymmetry, a common practical heuristic emerges: extreme VSTOXX values (thresholds above 30 or 35 are often discussed) historically often coincide with local Euro Stoxx 50 lows. That makes VSTOXX a rough contrarian gauge (indicator whose high value tends to coincide with lows of the underlying), with no guarantee and with notable exceptions in prolonged bear markets like 2008 or 2022.
Example: VSTOXX spike in early August 2024
In early August 2024 the VSTOXX behaved as a rough stress sensor. On Monday, 5 August 2024, VSTOXX printed intraday around 35 while the Euro Stoxx 50 fell 4.1 percent in the same session. The trigger was the yen carry unwind combined with thin summer liquidity.
On Tuesday, 6 August 2024, VSTOXX had already retraced to around 24, and the Euro Stoxx 50 recovered 1.5 percent. By mid-August the index was back at the level before the spike.
The everyday analogy: a VSTOXX spike is like a fire alarm that signals panic but rarely the actual collapse. Important: this is a historical observation of a single event, not a repeatable signal, not a recommendation, and no guarantee of comparable follow-up episodes.
Use case for DAX investors
The Euro Stoxx 50 and the DAX track each other very tightly during the trading day, the daily correlation of index returns has sat above 0.9 for years. By extension VSTOXX also acts as a rough vol gauge for DAX traders, even though the direct DAX volatility index VDAX-NEW exists in parallel.
Translating into expected daily movement: the rule of 16 (annualized volatility divided by 16 gives expected daily movement in percent, because the square root of 252 trading days is 15.87, rounded to 16) provides a quick heuristic. A VSTOXX of 20 corresponds to 1.25 percent expected daily movement in the Euro Stoxx 50. It only transfers roughly to the DAX given the high index correlation; the expected DAX move is measured precisely by the VDAX-NEW.
- VSTOXX 12
- 12 / 16 = 0.75 % expected daily move
- VSTOXX 16
- 16 / 16 = 1.00 % expected daily move
- VSTOXX 20
- 20 / 16 = 1.25 % expected daily move
- VSTOXX 32
- 32 / 16 = 2.00 % expected daily move
- VSTOXX 48
- 48 / 16 = 3.00 % expected daily move
Anyone trading DAX-specific setups rather than Euro Stoxx 50 should additionally look into the VDAX-NEW (DAX volatility index from Deutsche Börse, methodologically related to VSTOXX), rather than relying blindly on VSTOXX. Both indices usually move closely together, but on days with DAX-specific news (index changes, ECB decisions) they can diverge clearly. For a relative per-underlying view, the IV Rank provides standardization over an underlying's own 52-week range instead of relying on an absolute index value.
Where to find VSTOXX data
Current and historical VSTOXX values are available from the original index and exchange sources, complemented by data feeds of common brokers and data providers.
- STOXX index page with methodology guide, sub-index tables and real-time values. stoxx.com
- EUREX product page for FVS futures and OVS2 options with contract specifications. eurex.com
- Broker data feeds: Interactive Brokers, Captrader, BANX and comparable EUREX-enabled platforms typically stream live VSTOXX values at no extra cost, because the index is priced as an index datum, not as a tradable product.
- Academic analyses of historical VSTOXX data are available in Carr/Wu (2006) and in the STOXX VSTOXX 101 whitepaper (October 2024).
Practice: VSTOXX as a market-stress filter in OptionsApp
Premium sellers running iron condors, bull put spreads or strangles on Euro Stoxx 50 or DAX options typically only want to enter when volatility is elevated, i.e. only when the premium per unit sold is rich enough. Manually that means checking charts, looking up VSTOXX, scanning the term structure, then entering. Across several underlyings during the day this is hardly doable consistently. The classic pain point: inconsistent entry discipline and missed premium windows because no one is at the screen during the volatile morning hours.
In OptionsApp a VSTOXX threshold can be stored as an Entry Condition for the trade template, for example via an external webhook signal (e.g. from TradingView). The example (VSTOXX above 25) is illustrative, not a recommendation. Strategies only open when the Entry Condition is met; profit target, position review and stop logic then run mechanically against the rules set in the template. This allows the "only sell during elevated market vol" idea to be enforced consistently without orders being entered by hand during the day; monitoring the positions remains the trader's job. Opening strategies automatically is the relevant workflow here.
Concrete threshold values, strategy selection and sizing remain the trader's responsibility. OptionsApp provides the mechanical execution of the rulebook once it is configured.
From practice
In practice the VSTOXX works less as a primary criterion and more as a rough context gauge alongside the IV Rank per underlying. The observations below are general practical insights and not a recommendation.
Three practical observations on Euro Stoxx 50 options:
- The absolute VSTOXX level tends to be less reliable than the combination of VSTOXX level and the term-structure shape of FVS futures.
- In FVS futures backwardation phases, reduced sizing or pausing new entries can serve better than business-as-usual.
- A V-VSTOXX (vol-of-vol index) above 130 is considered a somewhat more reliable early-warning gauge than a VSTOXX above 25, because V-VSTOXX captures uncertainty about the VSTOXX itself.
VSTOXX FAQ
What is the VSTOXX?
The VSTOXX (EURO STOXX 50 Volatility Index, ticker V2TX, ISIN DE000A0C3QF1) is a volatility index calculated by STOXX Limited and EUREX that expresses the market-implied 30-day variation of the Euro Stoxx 50 in annualized percent. Its basis is the bid-ask quotes of liquid Euro Stoxx 50 options on EUREX.
How is the VSTOXX calculated?
The VSTOXX is built from a model-free variance swap replication. Expected variance is summed from a strip of OTM puts and calls in the nearest Euro Stoxx 50 expirations, interpolated to 30 days, annualized and converted to a vol-point value via the square root. The calculation runs every 5 seconds during trading hours.
What is the difference between VSTOXX and VIX?
The VIX tracks the S&P 500 and is calculated by CBOE, the VSTOXX tracks the Euro Stoxx 50 and is provided by STOXX Limited and EUREX. Methodologically both are very close, both use variance swap replication. Differences include underlying, exchange, future multiplier (100 EUR vs 1,000 USD) and settlement (VSTOXX TWAP between 11:00 and 12:00 CE(S)T vs VRO auction).
Where can you trade VSTOXX futures?
VSTOXX futures (symbol FVS) and options on VSTOXX futures (symbol OVS2) are listed on EUREX and tradable through any EUREX-enabled broker. Both are cash-settled. FVS futures are high-risk derivatives and not suitable as a long-term investment.
What does a high VSTOXX value mean?
A high VSTOXX value means the market expects elevated 30-day variation of the Euro Stoxx 50. Historically, readings above 30 often coincided with index lows. That makes VSTOXX a rough contrarian heuristic, with no guarantee and with notable exceptions in prolonged bear markets.
How large is a VSTOXX futures contract?
An FVS future carries a multiplier of 100 EUR per volatility point. At a VSTOXX of 20, one contract has a nominal value of 2,000 EUR. That is roughly one tenth the size of a standard VIX futures contract (1,000 USD per point), which makes VSTOXX futures more capital-efficient to trade.
Execute premium-selling rulebooks VSTOXX-filtered and automated
OptionsApp lets you store a VSTOXX threshold as an entry filter in a trade template, for example via external webhook signals. The app's documented underlying focus is on US instruments such as SPX. Profit target, position review and stop logic run mechanically against the values you set. Strategy choice, sizing, market view and monitoring remain the trader's call.
More in the automated premium-selling guide.