
Implied Volatility · Glossary
IV Rank (IVR): What it tells you and how to use it
Founder of OptionsApp, active in the markets for 20+ years.
IV Rank in 30 seconds
IV Rank (Implied Volatility Rank, IVR) is an options trading metric that places the current implied volatility of an underlying on a 0 to 100 scale within its 52-week range.
The formula is: IVR = (current IV − 52-week IV low) / (52-week IV high − 52-week IV low) · 100. Result between 0 and 100. In trading practice, values above 50 can serve as a phase of elevated volatility and therefore as a typical filter criterion for premium sellers. IV Rank is a context indicator, not a directional signal.
Key takeaways at a glance
- IV Rank measures the position of current IV within the 52-week range, scaled to 0 to 100.
- Formula: IVR = (IV_today − IV_min_52w) / (IV_max_52w − IV_min_52w) · 100.
- tastytrade heuristic: IVR above 50 can serve as a typical filter for premium-selling setups, IVR below 25 as a long-vol regime.
- Weakness: outlier-sensitive. A single earnings spike distorts the 52-week high and depresses IVR for months.
- More robust alternative: IV Percentile does not measure the range but the share of 252 days with lower IV.
- IV Rank is a context indicator (options expensive or cheap relative to the underlying's own history), not a directional signal.
IV Rank is an options trading metric that places the current implied volatility (IV), the expected variation of an underlying derived from option market prices, within its own 52-week range. IV Rank turns an absolute IV value into a relative reading and answers the question: are options on this underlying expensive or cheap compared to the last year? Closely related are IV Percentile (IVP) and systemic vol indices like the VIX or its European counterpart VSTOXX. The metric typically ranges between 0 and 100; because the reference range is usually based on daily-close data, a live reading can briefly sit above or below that band, per tastytrade, when current IV exceeds the prior 52-week high or drops below the 52-week low. In the convention documented by tastytrade, an IV Rank above 50 counts as a phase of elevated volatility and a typical lower bound for premium-selling setups.
Scale
0-100
dimensionless
Lookback
252 days
about 52 trading weeks
Heuristic
> 50
premium-seller filter
On this page
What is IV Rank? Definition and context
The implied volatility of an underlying is expressed in percent, but as a raw number it carries little context. An IV of 35 percent sounds high at first glance, yet for a high-vol biotech stock it is closer to normal, while for a calm utility it would be an exception. This is where IV Rank comes in: the metric maps any absolute IV onto the underlying's own history.
IV Rank places current IV within the 52-week range (difference between the IV high and IV low of the last 252 trading days) and reports the result as a percentage between 0 and 100. IVR 0 means IV sits at the lowest point of the last year. IVR 100 means it sits at the 52-week high. At IVR 50 it is exactly in the middle of the range.
The metric was popularised by the US broker platform tastytrade as a standard reference for its premium-selling methodology (premium seller, the option writer who collects the credit and bears the assignment risk). Today IV Rank is integrated in virtually every options trading platform. The methodology itself is trivial, its strength lies in the simplification: an abstract volatility number turns into an immediately comparable score.
Calculating IV Rank: formula with SAP example
The calculation requires three values: the 52-week IV high, the 52-week IV low and the current IV. The common IV reference is the ATM (At the Money, strike near the underlying price) option with about 30 days to expiration, because that constellation is the most liquid and least affected by smile effects.
- Current IV
- 45 %
- 52-week low
- 22 %
- 52-week high
- 58 %
- IVR
- (45 − 22) / (58 − 22) · 100
- = 23 / 36 · 100
- IVR
- ≈ 63.9Current IV sits in the upper third of the 52-week range
IVR = (IV_aktuell − IV_min_52W) / (IV_max_52W − IV_min_52W) · 100Reading the result: an IV of 45 percent sounds high in isolation, yet in the historical context of the last 252 trading days SAP only sits in the upper third of its own IV range, not at the high. This relative reading is exactly what IVR delivers at a glance.
Calculate IV Rank yourself
Reading: elevated IV zone.
Values above 50 are often used as a filter threshold for elevated premium in premium-selling practice. IV Rank is a context indicator, not a buy or sell signal and not investment advice.
IV Rank vs IV Percentile: comparison table
Alongside IV Rank a second, closely related metric exists: IV Percentile (IVP, share of the last 252 trading days on which IV was below the current value). Both values are reported on a 0-to-100 scale but conceptually measure different things. The table below contrasts the most important differences.

| Criterion | IV-Rank (IVR) | IV-Percentile (IVP) |
|---|---|---|
| Calculation | (IV − IV_min) / (IV_max − IV_min) · 100 | Share of 252 days with IV below IV_today · 100 |
| Scaling | 0 to 100, range-based | 0 to 100, distribution-based |
| Outlier sensitivity | high (one spike in high/low distorts 12 months) | low (1/252 weight per day) |
| Statement | "Where does today's IV sit in the range?" | "On how many days was IV lower?" |
| Practical fit | default filter, fast to compute | sanity check when outlier distortion is suspected |
| tastytrade convention | primary indicator | secondary indicator |
| Weakness | earnings spikes depress subsequent readings | reacts more slowly to new vol regimes |
- Typical IV range (12 months)
- 15-25 %
- One-time earnings spike
- 60 %
- Current IV
- 30 %
- IV-Rank
- ≈ 33 (looks low)
- IV-Percentile
- ≈ 95 (looks high)Same market, two very different readings
This discrepancy is not a measurement error but structural. IV Rank only sees the range endpoints. If a single earnings day pushed IV to 60 percent, IVR treats that value as an equally valid 52-week high. IV Percentile weights each day equally and therefore arrives at a very different reading. Which lens is correct depends on the use case.
tastytrade heuristic: IVR thresholds for premium sellers
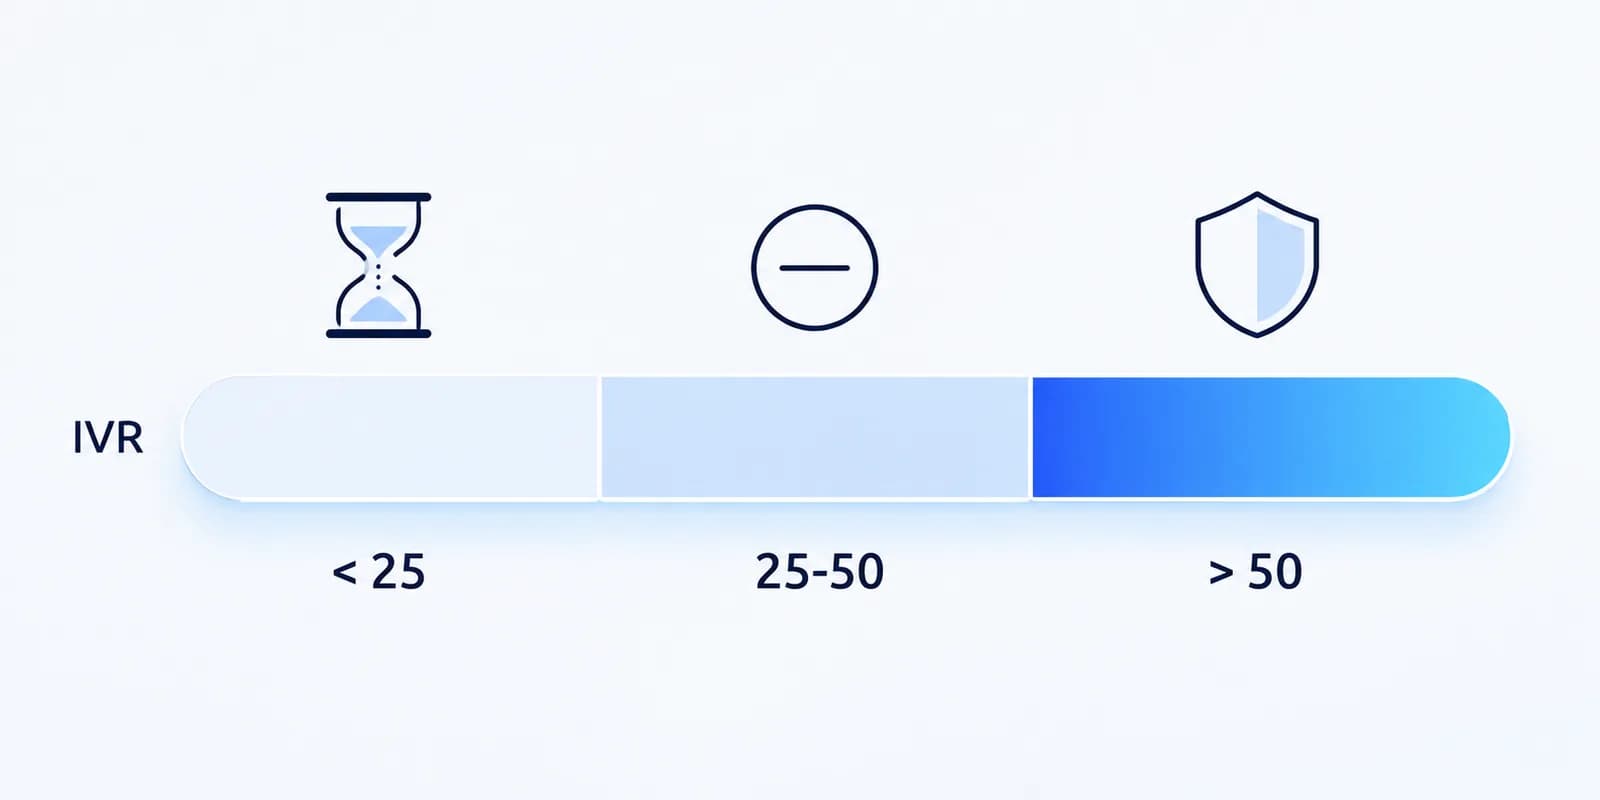
The US broker platform tastytrade has consistently integrated IV Rank into its methodology over many years. Three thresholds have emerged as a discussion standard. They are not laws of nature but conventions: practice-tested orientation points that every trader should check against their own account and underlying universe. The thresholds stem from the tastytrade documentation on volatility metrics.
- IVR > 50
- high-vol regime, typical filter for short strangle, iron condor, short put
- IVR 25-50
- neutral range, situational
- IVR < 25
- low vol regime, more long calendar or debit spread than premium-selling setup
Behind the logic stands vol mean reversion (statistical tendency of volatility to revert to its long-term mean). Selling during phases of relatively high IV (short strangle, simultaneous sale of an OTM call and OTM put on the same underlying and expiration) positions the trader for a move back to the normal regime. Buying during phases of relatively low IV positions for a vol rise. Important: for the sensitivity of trade P/L to IV moves the Greek Vega is what matters, not IVR itself.
Some traders deviate from the 50/25 thresholds and use IVR above 30 as an entry filter to achieve more trade frequency. Others only trade above IVR 70. Which threshold is the right one depends on account, trade-frequency expectation and underlying universe and is an individual decision.
Outlier sensitivity: why one spike distorts IVR for months
The biggest weakness of IV Rank lies in the range definition itself. The indicator looks exclusively at the 52-week high and 52-week low. Both are single events that can be dominated by a single trading day. If the IV of an underlying rises on an earnings day from 25 percent to 58 percent and falls back to 26 percent the next day, the 58 still becomes the valid 52-week high of the indicator.
Example: assume SAP had an earnings spike to IV 58 percent in February. That 58 remains the IVR 52-week high for the next 12 months. Any normal IV rise to 30 to 35 percent in the following months looks low in IVR, around 30. The trader thinks options are cheap, but they are only cheap relative to a one-off spike. Classic consequence: premium sellers open with too thin premia because IVR signals false safety.
This is exactly where IV Percentile helps as a sanity check. If IVP sits clearly above IVR (say IVR 30 with IVP 80), that is a clear sign of outlier distortion. Traders who track both metrics in parallel get an honest reading that IVR alone does not provide.
EU earnings case SAP: IVR trajectory around quarterly results
Earnings reports deliver the cleanest textbook case for IVR moves. In the run-up, options markets price in growing uncertainty, IV rises, IVR climbs accordingly. Right after release the uncertainty evaporates and IV drops back: this effect is called IV crush (abrupt IV decline after a trigger event such as quarterly results). The table below shows an example trajectory around SAP earnings (synthetic demo values, oriented on typical EU earnings patterns).
| Day | IV (ATM, 30 DTE) | IVR | Reading |
|---|---|---|---|
| T-7 | 28 % | 35 | calm lead-up |
| T-3 | 41 % | 71 | lead-up rise, options getting expensive |
| T-1 | 48 % | 84 | peak before release |
| T+1 | 24 % | 28 | IV crush after release |
A possible example setup for a premium-selling trade on this constellation could look as follows: a short strangle, opened around T-2 with short strikes at 16-delta (option price sensitivity to a 1-point move of the underlying) on the call and put side, about 30 DTE (Days to Expiration) and a profit target (predefined profit threshold that triggers closing) of 50 percent of collected credit.
Example setup
- Underlying: SAP
- Strategy: Short Strangle
- Entry: T-2 vor Earnings
- Short-Strikes: Delta-16-Call + Delta-16-Put
- DTE: about 30
- Profit-Target: 50 % of collected credit
- Filter: IVR > 70 at the time of entry
Important context: the example setup above describes a typical pattern, not a rulebook. Earnings trades carry meaningful gap risk between T-1 and T+1 because a strong underlying move can produce a loss even with collapsing IV. Concrete thresholds, strikes and sizing depend on the individual account, experience and risk profile and must be defined individually. Risk-defined variants like an iron condor are not a direct substitute for the theoretically unbounded short strangle, but a distinct strategy with capped profit potential.
Calculating IV Rank in Python (pandas)
Computing IV Rank in-house avoids dependence on broker-specific conventions and lets the methodology be applied to any underlying universe. The pandas function below implements IVR and IVP per the tastytrade methodology. The input is a daily IV time series (e.g. ATM 30-day IV or a modelled IV per expiration) passed as a pd.Series.
import pandas as pd

def iv_rank(iv_series: pd.Series, window: int = 252) -> pd.Series:
    """
    IV-Rank nach tastytrade-Methodik.
    iv_series: tägliche IV-Werte (z.B. ATM-30-Tage-IV) als pd.Series.
    window: Lookback-Fenster in Handelstagen, Default 252 (ein Jahr).
    Rückgabe: pd.Series mit IV-Rank-Werten zwischen 0 und 100.
    """
    iv_min = iv_series.rolling(window=window, min_periods=window).min()
    iv_max = iv_series.rolling(window=window, min_periods=window).max()
    return (iv_series - iv_min) / (iv_max - iv_min) * 100


def iv_percentile(iv_series: pd.Series, window: int = 252) -> pd.Series:
    """
    IV-Percentile nach tastytrade-Methodik.
    Rückgabe: Anteil der letzten 252 Tage mit IV unter aktuellem Wert, in Prozent.
    """
    return iv_series.rolling(window=window, min_periods=window).apply(
        lambda x: (x[:-1] < x[-1]).mean() * 100, raw=False
    )


# Beispiel mit SAP-Werten (synthetisch fuer Demonstration)
sap_iv = pd.Series([0.22, 0.25, 0.28, 0.31, 0.35, 0.40, 0.45], name="SAP_IV")
print(f"IVR aktuell: {iv_rank(sap_iv, window=5).iloc[-1]:.1f}")
print(f"IVP aktuell: {iv_percentile(sap_iv, window=5).iloc[-1]:.1f}")
For production use, add a data source (broker API, yfinance as an EOD provider, your own IV database) and a min_periods handling for the first 252 days, where the rolling window is not yet fully populated. Verifying the calculation in a notebook gives a reproducible foundation for backtests and screeners.
Step-by-step: using IVR in the trading workflow
Traders who use IVR consistently as a filter benefit from a clear, repeatable workflow. The sequence below summarises the typical steps as they have settled in practice.
- Build a watchlist: 20 to 50 liquid underlyings from the EU and US universe, broadly diversified across sectors.
- Pick a data source: broker platform or own Python job based on the function shown above.
- Define the minimum threshold: e.g. IVR above 50 as a typical premium-selling filter, the concrete threshold is a convention choice.
- IV Percentile as sanity check: when outlier distortion is suspected, run IVP in parallel and question strongly diverging values.
- Check the earnings calendar: high IVR with earnings in five days is event risk, not cheap premium.
- Choose the strategy: IVR above 50 can be used for premium-selling setups, IVR below 25 more for long-vol setups such as calendars or debit spreads.
When IVR fails: 4 warning signals
IVR is not a universal indicator. Four constellations recur in practice and can produce false signals. The list below summarises the typical pitfalls.
- IVR low, IVP high: classic outlier distortion. IVR looks unattractive even though IV measured on a day-by-day distribution sits in the upper range.
- IVR > 50 with earnings in 5 days: the high premium is an event-risk markup, not cheap vol. IVR here does not signal a standard premium-selling setup.
- IVR jump from 30 to 70 in one day: a macro event or underlying-specific shock. Mean-reversion assumptions do not hold in this constellation.
- Underlying with thin options liquidity: the IV values themselves become unreliable because mid prices are not based on real market activity. IVR built on that is noise.
IVR is not a prediction tool: a common confusion
One of the most stubborn beginner mistakes reads: high IVR means the market will fall. That interpretation is wrong. High IVR simply means that options are expensive relative to the underlying's own history. The metric says nothing about underlying direction.
- High IVR ≠ buy signal: a stock can keep rising or fall at IVR 80, both are possible.
- Low IVR ≠ sell signal: at IVR 10 the underlying is not automatically ready for a correction, only option prices are low compared to history.
- IVR is not a timing tool: the metric provides context on the vol situation, not an entry signal in the sense of a trend indicator.
Practically: IVR tells you whether premium-selling setups deliver statistically more attractive credits than on average. It does not tell you that the underlying will move up or down next. Mixing the two builds setups on an assumption the metric does not support.
IVR in the cluster: relation to IV, VIX and VSTOXX
IV Rank is an underlying-specific metric and sits alongside, not in competition with, other volatility metrics. The parent concept is implied volatility, from which every IVR value is derived. IVR turns that absolute quantity into a relative reading per underlying.
At the systemic level, the VIX as a systemic volatility index for the S&P 500 performs a similar role, just without the 52-week reference. VIX shows absolute expected vol of the US market, IVR shows the relative position per stock. Both complement each other: VIX above 25 with IVR 80 on a specific underlying is a different context than VIX 14 with IVR 80 on the same underlying.
For EU underlyings the VSTOXX as the EU counterpart to VIX is the appropriate systemic reference. Traders of SAP or Allianz get the European market vol situation from VSTOXX and the individual reading per stock from IVR.
Lessons from trading practice
As a rule of thumb, IVR works less well as a standalone criterion than as one filter within a broader condition set, the way such entry criteria interact in automated options trading. The observations below are practice- and observation-based and do not replace an individual rule set. How to build them in depends on the respective workflow.
Three recurring observations:
- The raw IVR value on its own tends to be a weaker entry filter than the combination of IVR and IVP. Outlier-driven low IVRs can lure traders into thin-premium setups where the collected credit does not cover the risk.
- For EU underlyings like SAP or Allianz, earnings filters tend to carry the biggest lever. A high IVR three days before quarterly results is rarely a reliable entry signal, because the subsequent move can dominate the gap risk.
- Consistent application across the entire watchlist usually pays off more than fine-tuning a single IVR threshold. Softening the 50 threshold for individual trades often undermines the discipline of the whole approach.
IV Rank FAQ
How is IV Rank calculated?
IV Rank = (current IV − 52-week IV low) / (52-week IV high − 52-week IV low) · 100. Example SAP with an IV range of 22 to 58 percent and current IV of 45 percent: (45 − 22) / (58 − 22) · 100 yields about 63.9. Purely computationally the result sits between 0 and 100; in practice a live value can briefly fall outside that band if the 52-week reference has not yet caught up to the current day. Edge case: if the 52-week high and low coincide (IV was flat for a year), the denominator is zero and IV Rank is undefined.
What is a good IV Rank for selling options?
In the tastytrade convention an IVR above 50 can serve as a typical threshold for premium-selling setups. Some traders use IVR above 30 for higher trade frequency. These are heuristics, not hard rules; the suitable threshold depends on account, risk profile and underlying universe.
What is the difference between IV Rank and IV Percentile?
IV Rank measures the position of the current IV within the 52-week range (range-based). IV Percentile measures the share of 252 trading days on which IV was below the current value (distribution-based). IV Percentile is more robust against single outlier spikes, IV Rank reacts faster to fresh vol regimes.
What does an IV Rank of 50 mean?
An IV Rank of 50 means current implied volatility sits exactly in the middle of the 52-week range. With a 52-week low of 20 percent IV and a high of 60 percent, IVR 50 corresponds to a current IV of 40 percent. In tastytrade convention this value is frequently discussed as a lower bound for premium-selling setups.
Is a high IV Rank a buy signal?
No. IVR is a context indicator, not a directional signal. A high IVR means options are expensive relative to the underlying's own history, not that the market will fall or rise. The most common beginner mistake is exactly this confusion.
What IV Rank counts as low?
In the tastytrade convention an IV Rank below 25 counts as low. Current IV then sits in the lower quarter of the 52-week range. With a range of 20 to 60 percent IV, IVR 25 corresponds to a current IV of 30 percent. In such phases premium-selling credits are comparatively thin, which is why long-vol setups like calendar or debit spreads are often discussed.
How do IV Rank and VIX differ?
IV Rank measures the relative IV position of a single underlying within its 52-week range, scaled to 0 to 100. VIX is an absolute volatility index of the S&P 500 without a 52-week reference, quoted directly in volatility percentage points. For EU underlyings VSTOXX is the counterpart. IVR and VIX complement each other: VIX 25 with IVR 80 is a different context than VIX 14 with IVR 80.